![[Home]](http://www.bayleshanks.com/cartoonbayle.png)
http://etfdb.com/cheapest-etf-for-every-investment-objectives/
---
Mark Sebastian (optionpit)'s watchlist (from https://www.youtube.com/watch?v=RXfh7fe44SM):
AA AAL AAPL AMZN BABA BBY DG F FB FIT GLD GOOG GOOGL GPRO GRPN GS HPQ IBM IWM JPM LNKD MSFT NFLX QQQ SPY TLT TSLA TWTR USO UVXY VXDN VXUP VXX XLB XLE XLF XLI XLk XLP
non-company ones (todo):
GLD IWM QQQ SPY TLT USO UVXY VXDN VXUP VXX
sector ETFS: XLB materials XLE energy XLF finance XLI industrial XLK tech XLP consumer
Chris Ciovacco's watchlist from http://chrisciovacco.tumblr.com/post/129413629776/are-stocks-setup-for-another-big-leg-down:
SPY EEM XLF GSPC IXIC DJI IWM EFA XLE XLU QQQ XLK
mitch zacks's watchlist from http://mitchzacks.tumblr.com/post/129412474332/focus-on-the-trend-lines-not-the-headlines : SPY 195.45 -3.24 IVV 197.55 -3.35 VOO 180.13 -2.96 IWB 110.06 -1.77 VONE 90.89 -1.51 IWV 117.39 -1.94 VTHR 91.03 -2 IWM 115.72 -1.62 VTWO 93.1 -1.29 TWOK 68.56 -1.85
---
" spot VIX and futures converge each month and this trade is essentially free money. The reason for the price difference between spot VIX and futures stems from the principle that VIX is mean reverting. This generally keeps the price of VIX futures higher than spot VIX when VIX is lower than ~20 (the long term average) and VIX futures lower than VIX when VIX is above ~20. " -- http://seekingalpha.com/article/3200626-the-fatal-flaws-of-vxup-and-vxdn
---
PowerShares DB Japanese Government Bond Futures ETN (JGBL)
Vanguard Japan Government Bond Index Inv JPY http://www.morningstar.co.uk/uk/funds/snapshot/snapshot.aspx?id=F00000274I https://us.spindices.com/indices/fixed-income/sp-japan-government-bond-index http://www.bloomberg.com/quote/BJPN:IND http://www.morningstar.com/InvGlossary/morningstar-japanese-bond-index-hdg.aspx JGB
---
http://www.etf.com/sections/blog/22148-3-unloved-etfs-with-big-potential.html?nopaging=1
JGBB "The fund shorts five- to 10-year JGB futures, while taking on an equal notional “long” position in ultra-short Treasury bills with maturities of less than three months. Per WisdomTree?, JGBB had a negative duration of -6.87 as of March 31, 2014. From a currency perspective, JGBB carries a net notional short position in the Japanese yen against the US dollar. It targets roughly a 30 percent notional yen short, though that short exposure is currently about 24 percent.", also JGBS BBRC "BBRC strips out the BRICs, plus Taiwan and S. Korea, focusing on smaller emerging markets. It goes even further down the development chain, saving 25 percent of its weighting for frontier markets."
---
People say that buying put options on your stock portfolio is 'insurance' and suggest buying insurance for your portfolio, which may or may not be a good idea. Consider car insurance; let's pretend it wasn't legally required, and you were deciding whether to buy it. I think you should. But since the insurance companies make a profit, doesn't this transaction have a negative expected return for you? So why buy it? Two reasons:
1) Unless you're a taxi driver, when you consider the activity of driving your car, you don't really want to make it the center of your life and focus on optimizing it the way you would a business; you just want to get from place A to place B. Driving is not your 'core competency'. You want to remove hassle and risk and focus on other areas of your life.
2) If you were to get in a big accident, it could bankrupt you. For the most part, you want the chance of that to be as close to zero as possible. Even if it wouldn't quite bankrupt you, the Kelly criterion shows us that a positive expected return on a single transaction can still be irrational if the risk is too big in comparison to your net worth. Car accidents fit this profile. You can't diminish the magnitude of the potential loss by driving less; if you drive at all you might have a big accident, and you don't want to quit driving. So the Kelly criterion says that it's rational for you to accept a negative expected value in order to get rid of this risk.
Does this same reasoning apply to buying insurance on your portfolio? No:
1) A primary reason that you are investing in stocks (instead of eg bank savings accounts, bank CDs, bonds) is to make money on capital appreciation. But a lot of this capital appreciation is due to a risk premium. So your 'business' here IS to take risk; so this isn't like the car example where you want to pay to simplify the part of the activity that isn't the main point; taking risk IS (at least part of) the main point. This is providing a primarily COGNITIVE benefit; it is creating an artificial wall to separate two things that would otherwise be related, simplifying your life so that you can focus.
2) Unlike car accidents, you can reduce the size of the potential loss from a stock investment in a smooth manner just by allocating less of your portfolio to stocks. This way you avoid paying the premiums to the insurance company (the put option seller).
Now, it may still make sense to buy put options in some cases. First, if you think insurance is underpriced (but then you're trying to beat the market). Second, if you have some weird requirement to maintain a minimum level of net worth yet also have a reason to take more risks than most (eg pension funds; see [1]); third, if you are executing some weird active beat-the-market strategy that involves but isn't really based around the ordinary risk of stock investing and, just like the car example, you want to focus on your core competency (your weird strategy) and not have to think about the chance that stocks fall off a cliff (again, see [2]).
And another case i'm not sure about: fourth, if for some reason you want to own stocks rather than eg bonds, CDs, etc, but DON'T want to take on the equity risk premium, and are comfortable getting bond-like returns.
---
" Lo: I think there’s definitely a case in point of the idea of alpha becoming beta. The idea that once you start popularizing a particular investment approach, and it becomes so popular, that in and of itself creates these kinds of shock waves. So for example if the strategy itself underperforms, now we have a larger number of investors that are going to be unwinding that strategy and that will create a kind of cascade effect where the strategy will underperform even more as people start to take money out of the strategy. There are a number of examples. Risk parity, of course, is the most recent. But before that trend following, before that value investing, growth investing, earnings surprise, earnings momentum, any kind of a strategy can become a crowded trade. And when it does you have to just make sure that the risk premium associated with that trade is commensurate with the potential risks of getting hit with these unwinds. " -- http://www.bloomberg.com/news/articles/2015-09-08/mit-quant-guru-andrew-lo-on-market-s-meltdown-august-sucks-
---
http://finance.yahoo.com/news/interest-rate-rise-turning-point-102702296.html
note:
"Analysts say the pharmaceuticals and healthcare industry, which has been engaged in a wave of debt-fuelled dealmaking, could be one of the hardest hit sectors when rates rise.
Fitch downgraded its outlook on the sector from stable to negative at the start of the year, though it did little to dampen investor appetite for chunky debt offerings. "
---
" Do absolute return, market-neutral and long-short mutual funds offer enough protection in bear markets to make up for their lagging performance during recoveries? No, according to an analysis by professors Jingzhi Huang of Penn State University and Ying Wang of State University of New York, Albany.
Not even Vanguard Group, the usually sober low-cost leader, has had much success in this category. Its Vanguard Market Neutral fund tries to mimic the return on three-month Treasury bills but lagged its index by 2.4 percentage points a year over the past half-decade, according to Morningstar. "
another scary thing:
http://blog-imfdirect.imf.org/2015/05/05/european-life-insurers-unsustainable-business-model/
---
very old mutual fund total return Sharpes can be had via eg:
http://finance.yahoo.com/q/pm?s=MITTX+Performance
from the section "Annual Total Return (%) History"
btw ycharts has lots of great info and loads very quickly:
http://ycharts.com/mutual_funds/M:MITTX
---
http://money.stackexchange.com/questions/3874/is-the-yale-swenson-asset-allocation-too-conservative-for-a-20-something/3889#3889 http://www.marketwatch.com/lazyportfolio/portfolio/yale-u-portfolio http://david-swensen.com/2008/10/27/david-swensen-portfolio-for-small-investors/
---
http://www.thestreet.com/story/10385337/1/best-performing-funds-over-the-past-20-years.html
on 10/19/07
summary (best and worst performing mutual funds over time period from Black Monday, Oct 19, 1987 (inclusive or exclusive?), until sep 30 2007: 20 best performing funds : sector health (3x), mid cap (2x), sector natural resources, domestic growth (5x), sector tech/telecom (3x), sector financial svcs (4x), growth and income, aggressive growth 10 worst : small cap, domestic growth (2x), aggressive growth (4x), precious metals (2x), japan smallcap
conclusions: mid cap did well then and now. sector health did well then and now, as did parts of sector tech. aggressive growth seems dangerous, perhaps also smallcap. financial svcs did well then but not so much now.
---
advice for pension funds, but a good read nevertheless:
notes from that:
" The long horizon ((note: they seem to be talking about pension-fund-scale long-term, eg many decades)) confers a number of advantages over short ‐ term investors, including:
" In Section 2, we describe the two biggest investment mistakes made by investors that cause them to forfeit their long ‐ horizon advantage: procyclical investing and misalignments between asset owners and delegated managers " ((by "misalignments between asset owners and delegated managers" they seem to be talking about problems that individual investors wouldn't have, such as corruption in the pension fund management itself, or insufficient supervision of risk-taking in illiquid investment partnerships; so i'll neglect that part of the paper; they also talk about the incentive of fund managers to take on hidden risk in order to inflate returns and bring in more business))
" We recommend four basic steps for exploiting the long ‐ horizon edge: (1) Institutionalize contrarian behavior, (2) B uild a robust factor portfolio to harvest many sources of factor risk premiums , (3) Create close alignment between asset owners and managers, and (4) D emand sufficient risk premiums for illiquid investments. "
" 3.1 Institutionalize Contrarian Behavior
Investing counter ‐ cyclically is hard. It involves selling assets that have done well—when these assets are all the rage—and buying assets that have declined in price, sometimes precipitously, when the majority is shying away from them. Investing counter ‐ cyclically goes against human behavioral tendencies. It is much easier just to follow the crowd than to stand up as one of few contrarians and load up with risky assets at times when everyone else is doing exactly the opposite. The best way of investing counter ‐ cyclically is to institutionalize contrarian investment behavior. A strict rebalancing rule is a robust way of doing this. Rebalancing can be carried out in many different ways, and with many different schemes, but common to all of them is it forces investors to sell assets that have risen in value and to buy assets that have fallen in value, and doing so brings those assets back in line with fixed portfolio weights. Rebalancing is counter ‐ cyclical. 11 Many investors, however, with rebalancing rules failed to rebalance during the financial crisis. Some investors thought “this time is different” and simply put the rules aside. For other it was the lack of liquidity and/or risk capacity that caused the rebalancing rules to be breached. The paradox is that it is precisely during such challenging times you most need the rules. ...
One example of successful application of rebalancing rules is the Norwegian Government Pension Fund Global (the Norwegian sovereign wealth fund). The rules are set by the Parliament who is the owner of the risk on behalf of the current and future Norwegian population. Norway was the largest buyer of equities globally during 2008 ‐ 2009 and it is the discipline imposed by the rebalancing rule that allowed the fund to increase its equity holdings as many others were selling.
The performance of Japanese equities since the 1990s is an example where rebalancing between Japanese bonds and Japanese equity would have been produced losses. It is true that an investor would have been better off holding purely Japanese bonds during this time. However, investors with a rebalancing regime in place before the Japanese bubble started would have been sellers during the 1980s when prices were elevated and endured fewer losses. Japan is also only one part of a global portfolio and an important part of rebalancing is to rebalance over many different sources of risk premiums (see below). "
" There may be scope for improving rebalancing rules by including valuation dependent metrics. This would help investors to weight asset classes or risk premiums more than predicted by a simple rebalancing rule. A rebalancing rule with fixed weights certainly buys when an asset has declined in price, relative to other assets in the portfolio. A more aggressive rebalancing rule would buy even more if that asset’s expected return is high, relative to the risk premiums of other assets. To do this requires embedding a notion of valuation of that asset class in the rebalancing rule. These valuation ‐ based rebalancing rules must be constructed robustly. These rules need to redefine risk—which is often defined as volatility and based on short ‐ term measurements. Times with low volatility are called “low risk” and often coincide with high prices, like the mid ‐ 2000s, but these are actually periods of high risk because future expected returns are low. Using valuation rules would incorporate one measure of risk as the price paid against the long ‐ term fair value of risk premiums. "
" On the other hand, valuation metrics are regime dependent. In rare cases, valuation methods are no longer valid because a regime shift occurs. “This time is different” periods are extremely rare. 12 We recommend that formal rebalancing process should include safety valves for dealing with “catastrophe scenarios” which may include highly infrequent shifts in regimes. The key element is to have procedures that ensure discipline in the decision ‐ making process so that potential regime shifts can be discussed in the funds’ written investment beliefs. The risk of acting pro ‐ cyclically should be well understood by stakeholders and decision makers. Any decision on taking risk off the table must be made together with formal rules for when risk should be taken on again. Taking off risk is always easy. It is the ability to put on risk in troubled times that makes the difference between professional and mediocre investors. .... 12 Two examples of “this time is really different” are pre ‐ 1933 where the average spread between three ‐ month commercial paper yields and 10 ‐ year Treasury yields was positive and post ‐ 1933 where the average spread has been positive and pre ‐ 1987 where there was no downside skewness in the smile curve across strikes of implied option volatilities and post ‐ 1987 where there is negative skewness in implied volatilities "
" Factor risk exposure drives the bulk of expected risk and return for large, long ‐ horizon investors. Unfortunately this is generally not the way many funds organize their investments and how boards and top management prioritize their time. Too often, investors focus on selecting managers with “alpha” even when they contribute only marginally to total fund performance. "
" The financial crises over 2008 ‐ 2009 also exposed limitations in the current paradigm of using alternative asset management vehicles to improve on portfolio diversification. Their betas during these stressful times were higher than for the normal liquid asset classes. Using alternatives for diversification is costly and also contributes to complexity which makes it difficult to understand the true, underlying risk characteristics of the total portfolio. "
" A better model of diversification is to diversify across factors. Factors go beyond asset classes...Assets are bundles of different types of factors...Looking at asset classes can easily “double count” factors and lead to investors over ‐ estimating the true amount of diversification they are achieving, which the financial crisis made clear. For example, credit risk is in corporate bonds, credit derivatives, but also in equities and real estate.
"
" There are different types of factors. Examples of fundamental factors are inflation, economic growth, and political risk. Certain asset classes are factors themselves, like G10 sovereign bonds and developed market equities. Other asset classes, however, are certainly not factors like private equity and hedge funds, and instead bundle up different types of factor risk premiums in sometimes expensive, leveraged, and non ‐ transparent investment vehicles. There are also investment, or style factors, like value ‐ growth and momentum which transcend asset classes. Value ‐ growth, for example is the name given to buying assets with high yields (or low prices) and selling assets with low yields (or high prices). In foreign exchange, this strategy is called “carry” while in equities it is “value investing”. In fixed income, it is called “riding the yield curve” and in commodities it is called “the roll” and related to normalization or backwardization. Figure 2 shows pictorially how factors drive asset returns, which ultimately make up a portfolio’s total return. "
" ...having a long horizon does not mean that the long ‐ horizon investor should automatically invest in illiquid assets. ... Ang, Papanikolaou and Westerfield (2011) (Ang, A., D. Papanikolaou, and M. M. Westerfield, 2011, Portfolio Choice with Illiquid Assets, working paper, Columbia University.) explicitly consider the effect of illiquidity on asset allocation. 16 In their model of illiquidity, illiquid assets can only be rebalanced when a Poisson arrival occurs signaling a liquidity event. When there is no liquidity event, illiquid assets cannot be rebalanced. As the average period between liquidity events is made very small, the model nests the traditional asset allocation models where rebalancing is always possible. For illiquid assets like real estate or private equity, the average time between rebalancing events may be once every ten years.
There are three important findings in Ang, Papanikolaou and Westerfield (2011). First, illiquidity causes the investor to behave in a more risk ‐ averse manner with respect to both liquid and illiquid asset investments and this effective risk aversion is time varying. The intuition is simple. An investor cannot “eat” or consume out of illiquid assets, only from liquid wealth. If you are wealthy, but hold everything in illiquid assets, you cannot eat. Thus, the investor cares about the ratio of illiquid to liquid wealth. That is, the investor’s asset allocation and consumption depends on a solvency ratio. Harvard University found this out in 2008 where it had tremendous need for cash, but its endowment held large amounts of illiquid assets which could not be immediately liquidated to fund expenses.
Second, illiquidity risk makes illiquid assets much less compelling. As a baseline case, consider the full liquidity case where the optimal allocation to the illiquid asset is 59%, close to a typical 60% equity holding for many institutions. Now, suppose the risky asset can only be traded, on average, once per year. The optimal holding of the illiquid asset when the investor can rebalance is now 44%. When the illiquid asset can be rebalanced only once in 10 years, on average, the optimal proportion is only 5%. Clearly, optimal holdings of very illiquid assets should generally be very modest.
Third, investors should demand steep premiums to bear illiquidity risk. What increase in the expected return of the illiquid asset is required for the investor to have the same utility when all the assets are liquid? This is the compensation for bearing illiquidity risk. The illiquidity premiums are shown in Table 3. A single private equity fund that can be rebalanced once every 10 years, on average, should have a premium (or hurdle rate) of 6%. Illiquid assets that an investor can rebalance every two years require a 2% premium.
There is another reason why investors should demand a premium for investing in illiquid assets. Investing in illiquid assets involves considerable agency problems. The typical contracts are opaque, it is hard to monitor the fund managers, and market values are not observed. Typical contracts involving investment in illiquid assets exacerbate, rather than solve, agency issues.
Table 1. Optimal Illiquid Asset Holdings
Average Time Between Rebalancings	 Optimal Rebalance Value
10 years     	     			 0.05
5 years					 0.11
2 years					 0.24
1 year					 0.37
½ year					 0.44
Continuous Rebalancing			 0.59
Source: Ang, Papanikolaou and Westerfield (2011).
...
Table 2 Illiquidity Premiums

Average Turnover	 Illiquidity Premium
10 years		 0.060
5 years			 0.043
2 years			 0.020
1 year			 0.009
½ year			 0.007
"
---
the Piotroski strategy was the only one of the 2008 stock screeners to gain in the 2008 crash:
the other strategy in their sample with an astounding lifetime return is Zweig
todo: calculate Sharpe for these guys.
other links on those screeners:
(note: insiders did NOT do well, negative expected return at this time)
a post on http://www.oldschoolvalue.com/forum/discussion/302/stock-screener-comparison-morningstar-vs-aaii-stock-investor-pro/p1 points to some cautionary links (havent read them yet):
---
F_ROA + F_delta_ROA + F_CFO + F_ACCRUAL + F_delta_MARGIN + F_delta_TURN + F_delta_LEVER + F_delta_LIQUID + EQ_OFFER
all of these are binary variables (1 or 0). F_x means 1 iff x is positive, 0 otherwise, except for delta_LEVEL, where F_delta_LEVEL is 1 iff delta_LEVER is negative.
ROA: Net income before extraordinary items for the fiscal year preceding portfolio formation scaled by total assets at the beginning of year t.
delta_ROA: Change in annual ROA for the year preceding portfolio formation. ROA is calculated as ROA for year t less the firm’s ROA for year t-1.
CFO: Cash flow from operations scaled by total assets at the beginning of year t.
ACCRUAL: ROA - CFO; Net income before extraordinary items less cash flow from operations, scaled by total assets at the beginning of year t.
delta_MARGIN: Gross margin (net sales less cost of good sold) for the year preceding portfolio formation, scaled by net sales for the year, less the firm’s gross margin (scaled by net sales) from year t-1.
delta_TURN: Change in the firm’s asset turnover ratio between the end of year t and year t-1. The asset turnover ratio is defined as net sales scaled by average total assets for the year.
delta_LEVER: Change in the firm’s debt-to-assets ratio between the end of year t and year t-1. The debt-to-asset ratio is defined as the firm’s total long-term debt (including the portion of long-term debt classified as current) scaled by average total assets.
delta_LIQUD: Change in the firm’s current ratio between the end of year t and year t-1. Current ratio is defined as total current assets divided by total current liabilities.
EQ_OFFER: one if the firm did not issue common equity in the year preceding portfolio formation, zero otherwise
---
AAII looks pretty cool. Lifetime membership for $400
http://www.aaii.com/ http://www.aaii.com/journal
---
http://ttvalueinvesting.com/technicals-dynamics-stock-crash/
---
this study disputes the conventional wisdom that retail's use of active management underperforms indices:
http://www.thestreet.com/story/11305610/1/dumb-investors-turn-out-to-be-shrewd.html
" Rekenthaler says that the typical academic study looks at a group of 200 or so actively managed funds. Most often two-thirds or more of the funds failed to outdo their benchmarks during the previous 10 years. While the data in the studies may be accurate, the results don't necessarily reflect the experience of the typical investor, says Rekenthaler.
The problem is that most active funds have few shareholders and a tiny amount of assets. On average, the smallest funds have high fees and poor returns. In contrast, many big funds have low fees and high returns. The small funds only serve a limited number of investors, but the academic studies give equal weight to all funds -- regardless of their size. As a result, the dismal performance experienced by a small number of investors tends to reduce the average returns.
.... asset-weighted returns -- the average return of each invested dollar. That way you give more weight to large funds. Calculating the asset-weighted returns, Rekenthaler found that typical investors had been getting decent results.
On average the asset-weighted returns were higher than the returns recorded by weighting all funds equally. This suggests that investors are systemically selecting superior funds. "Investors have done better than if they had picked funds by throwing darts," says Rekenthaler.
According to the Morningstar data, investors have been gravitating to big funds with low expenses and strong returns. That has been a smart move. Because of economies of scale, big funds tend to have lower fees. The low expense ratios help the funds produce competitive returns. "The big funds are reasonably well run and cheaper," says Rekenthaler. "People are not doing major damage to themselves through fund selection."
Investors have proved particularly successful in picking small-cap funds. On an asset-weighted basis, small growth funds returned 3.98% annually during the 10 years ending in 2010. That topped the benchmark by 0.20%.
The asset-weighted results outdid the benchmarks in a variety of fund categories, including foreign large value, emerging markets and health funds. The active funds trailed in large growth and large value. Altogether the asset-weighted results outdid the benchmarks in eight of the 17 categories studied by Morningstar. In most categories where the active funds trailed, they lagged by small amounts. In general, investors in the active funds achieved results that were competitive with index funds. "
---
other buffet quotes: http://www.suredividend.com/17-of-warren-buffetts-best-quotes-analyzed/
---
---
one approach to value investing is the theory that price/x ratios like price/earning, price/book, price/sales can decline because either (a) the company is in financial distress, or (b) the company is overlooked, and that companies in category (a) should be avoided, but category (b) outperforms. Metrics like Piotroski's F-Score aim to recognize category (a) (my note: mb also see Altman's Z score?)
value investing is thought to outperform in bear markets, provided financially distressed firms are avoided (i saw this opined somewhere, but is there quantitative evidence for this?)
---
https://www.bogleheads.org/wiki/
---
here's a discussion on a strategy with:
40% Long Term Bonds 30% Stocks 15% Intermediate Bonds 7.5% Gold 7.5% Commodities
the consensus is that this is too conservative for long-term investors.
" 40% VUSTX Vanguard Long-Term Treasury Fund 30% VTSAX Vanguard Total Stock Market Index Fund 15% VFITX Vanguard Intermediate-Term Treasury Fund 7.5% GLD SPDR Gold Shares ETF 7.50% DBC PowerShares? DB Commodity Index Trac ETF
Here's a summary of the performance results from 2007 to today:
    Max drawdown: -13.37% (S&P was -50.95%)
    Worst year: -2.11% (S&P was -37.00%)
    Best year: 13.99% (S&P was 32.39%)
    CAGR: 13.16% (S&P was 14.27%)
    IRR: 6.63% (S&P was 7.81%)
    Portfolio Expense Ratio: 0.21%
" -- http://money.stackexchange.com/a/50049
---
vanguard small-cap: VSMAX
---
portfoliovisualizer.com
---
mutual funds vs ETFs:
---
https://en.wikipedia.org/wiki/Man_Group
---
http://www.etfscreen.com/corrsym.php?s=SPY
---
---
comparisons of clone ETFs:
http://www.marketwatch.com/story/why-your-choice-of-sp-500-etf-matters-2013-03-19?page=2 http://www.leveragedetf.us/versus
---
http://www.cnbc.com/2015/09/14/cramer-my-top-4-rules-to-owning-stocks.html
" No. 1 Tips are for waiters. No. 2 You must do the homework if you are going to own an individual stock. No. 3 If you can't do the homework, then own an index fund. No. 4 If you fear losing money, don't own stocks at all because they will go down as well as up. "
---
some important benchmarks:
XAO
| All Ordinaries |
| AMS EOE Index |
| BEL 20 Index |
| Bovespa Brazil 50 Index |
| Brazil Bovespa Stock Index |
| CAC 40 |
| CNX 100 |
| Consumer Discret Select Sector SPDR |
| Consumer Staples Select Sector SPDR |
| Credit Suisse Long-Short ETF |
| CurrencyShares? Euro Trust |
| DAX 30 Index |
| Diamonds Trust Series 1 |
| DOW 20 Transportation Index |
| Dow Jones Industrial Average |
| Dow Jones STOXX Large 200 Index |
| Dow Jones STOXX Mid 200 Index |
| Dow Jones STOXX Small 200 Index |
| Dow Jones STOXX50 |
| Dow Jones Transportation Average |
| Dow Jones Utility Average |
| Dow Jones Wilshire 5000 Composite Index |
| Energy Select Sector SPDR |
| Financial Select Sector SPDR |
| Financial Times Eurotop 100 Stock Index |
| Financial Times Eurotop 300 Stock Index |
| Financial Times Stock Exchange 100 |
| Financial Times Stock Exchange 250 |
| FINNISH Stock Index |
| FTSE Techmark 100 Index |
| FTSEUROFIRST 100 |
| FTSEUROFIRST 80 |
| Global X FTSE Nordic 30 ETF |
| Global X/InterBolsa? FTSE Colombia 20 ETF |
| Hang Seng China 50 Index |
| Hang Seng Composite Index |
| Hang Seng HK 35 Index |
| Hang Seng Stock Index |
| Health Care Select Sector SPDR |
| Hungarian Stock Index |
| IBEX 35 Index |
| Industrial Select Sector SPDR |
| IQ Hedge Macro Tracker |
| IQ Hedge Multi-Strategy Tracker |
| iShares Barclays 20+ Year Treasury Bond |
| iShares Barclays 7-10 Year Treasury |
| iShares Core S&P Total U.S. Stock Market |
| iShares Dow Jones US Basic Materials |
| iShares Dow Jones US Real Estate |
| iShares Dow Jones US Telecom |
| iShares FTSE/Xinhua China 25 Index |
| iShares MSCI ACWI Ex US ETF |
| iShares MSCI ACWI Index |
| iShares MSCI All Peru Capped Index |
| iShares MSCI Australia Index |
| iShares MSCI Austria Investable Market Index |
| iShares MSCI Belgium Investable Market Index |
| iShares MSCI Brazil Index |
| iShares MSCI BRIC Index |
| iShares MSCI Canada Index |
| iShares MSCI Chile Investable Market Index |
| iShares MSCI EAFE Index |
| iShares MSCI Emerg Markets Eastern Europe Index |
| iShares MSCI Emerging Markets Index |
| iShares MSCI France Index |
| iShares MSCI Germany Index |
| iShares MSCI Hong Kong Index |
| iShares MSCI Israel Cap Investable Market Index |
| iShares MSCI Italy Index |
| iShares MSCI Japan Index |
| iShares MSCI Malaysia Index |
| iShares MSCI Mexico Investable Market Index |
| iShares MSCI Netherlands Investable Market Index |
| iShares MSCI Pacific ex-Japan |
| iShares MSCI Poland Investable Market Index |
| iShares MSCI Singapore Index |
| iShares MSCI South Africa Index |
| iShares MSCI South Korea Index |
| iShares MSCI Spain Index |
| iShares MSCI Sweden Index |
| iShares MSCI Switzerland Index |
| iShares MSCI Taiwan Index |
| iShares MSCI Thailand Investable Market Index |
| iShares MSCI Turkey Investable Market Index |
| ISHARES MSCI UNITED KINGDOM |
| iShares Russell 2000 Index |
| iShares S&P Asia 50 Index |
| iShares S&P Europe 350 Index |
| iShares S&P Global Telecommunications |
| iShares S&P Latin America 40 Index |
| iShares S&P SmallCap? 600 Index |
| iShares Silver Trust |
| Japan Index |
| KFX Copenhagen Share Index |
| KOSPI200 Index |
| Market Vectors Africa ETF |
| Market Vectors Indonesia ETF |
| Market Vectors Oil Services ETF |
| Market Vectors Retail ETF |
| Market Vectors Russia ETF |
| Market Vectors Semiconductor ETF |
| Materials Select Sector SPDR |
| Mexico Bolsa Index |
| Midcap DAX |
| MSCI Asia Apex 50 Index |
| MSCI EAFE Index |
| NASDAQ 100 Stock Index |
| NASDAQ Composite Index |
| NIKKEI 225 |
| OMX Baltic 10 |
| OMX Index |
| Polish Traded Index |
| Portugal PSI 20 Index |
| PowerShares? DB Agriculture |
| PowerShares? DB Base Metals |
| PowerShares? DB Commodity Index Tracking |
| PowerShares? DB G10 Currency Harvest |
| PowerShares? DB US Dollar Index Bullish |
| PowerShares? India |
| Powershares QQQ |
| ProShares? Short QQQ |
| Russell 1000 Index |
| Russell 1000 Value Index |
| Russell 2000 Growth Index |
| Russell 2000 Index |
| Russell 2000 Value Index |
| Russian Depositary Index |
| S&P 100 Index |
| S&P ASX 50 |
| S&P TSX Composite Index |
| S&P TSX Venture Composite |
| S&P/ASX 100 |
| S&P/ASX 200 |
| S&P/ASX 200 Materials |
| S&P/ASX 300 |
| S&P/ASX 300 Metals and Mining |
| S&P/ASX All Australian 200 |
| S&P/ASX All Australian 50 |
| S&P/ASX Small Ordinaries |
| S&P/TSX 60 Index |
| S&P/TSX Midcap Index |
| Sensitive Index 30 |
| SGX MSCI Japan Index |
| SGX Straits Times Index |
| Short Dow 30 |
| Short MSCI EAFE Index |
| Short MSCI Emerging Markets Index |
| Short Russell 2000 |
| Short S&P 500 |
| Short S&P Mid Cap 400 |
| Short S&P Small Cap 600 |
| SPDR Barclays Capital High Yield Bond |
| SPDR DJ Euro STOXX 50 |
| SPDR Gold Shares |
| SPDR S&P 500 |
| SPDR S&P Emerging Middle East & Africa |
| SPDR S&P Homebuilders |
| SPDR S&P MidCap? 400 |
| SPDR S&P Oil & Gas Exploration & Prod |
| SPDR S&P Retail |
| Swiss Leader Index |
| Swiss Market Index |
| Swiss Midcap Index |
| Technology Select Sector SPDR |
| TOPIX Index |
| United States Natural Gas |
| United States Oil |
| Utilities Select Sector SPDR |
| Vanguard Balanced Index Fund |
| Vanguard Emerging Markets Stock ETF |
| Vanguard Pacific Stock ETF |
| Vanguard Total Bond Market ETF |
| Vanguard Total Stock Market ETF |
| WisdomTree? Managed Futures |
mcro
---
"Using 60% VTI, and 40% BND is a very close proxy for VBINX and should be an excellent 2 fund portfolio in an IRA." -- http://socialize.morningstar.com/NewSocialize/forums/t/304840.aspx
my note: vti expense .05%; bnd expense .07%; vbinx expense .23%
---
https://www.bogleheads.org/forum/viewtopic.php?t=78904
---
5 benchmarks:
vbinx (60/40), vt (total world stock), bnd (total bond), spy (multinational stock), qai (hedge multistrategy tracker)
3 benchmarks:
vbinx (60/40), vt (total world stock), bnd (total bond)
---
" Funds like Merger Investor (MERFX) and TFS Market Neutral (TFSMX) have long track records in managing alternative strategies. The downside is that this protection can be a bit expensive. The Merger fund has an expense ratio of 1.23% and TFS Market Neutral’s expense ratio is a hefty 2.02%. The underlying types of transactions made by these funds tend to drive up expenses. (For more, see: Hedge Fund Mojo for a Sinking Portfolio.)
Read more: Do Bear Market Funds Make Sense for Investors? http://www.investopedia.com/articles/professionals/091515/do-bear-market-funds-make-sense-investors.asp#ixzz3lrgWzSJv Follow us: Investopedia on Facebook
---
---
some comments on recentish performance of various ETFs (via http://stockcharts.com/h-perf/ui , which is total return):
vbinx (60% vt, 40% bnd): the best of the bunch; almost as much return as SPY, less volatility MINT: very steady very small return AGG: seems to beat BLKN and JNK since 2014, but JNK beats AGG if you go back to 2010 QAI: seems to deliver on its promise of small, steady returns SPY: been doing amazingly good recently VWO: WOW this thing is volatile -- and very very beta IAU: WOW very volatile, not too correlated with spy (beta) vnqi: like spy but a little worse vixh: like spy but slightly steadier, maybe better vxf: like spy but slightly better USCI: been falling, as expected WDTI, RYMFX: not very useful, much like USCI but worse than it (maybe could combine with USCI to reduce fluctuation though?) MCRO: poor BOND: doing great LTPZ: volatile, doing okay but not as good as eg TLT TLT: volatile, doing great SHY: even worse than MINT STPZ: been losing money recently EFA: like SPY but worse PCEF: like QAI but much more volatile for slightly higher returns iwn: like spy, currently underperforming a little hvpw: like qai but more volatile stip: doing poorly; underperforming shy; more volatile than shy; losing money since 2013; bkln: i forgot what i saw but it was similar to some of the other bonds
ief/bond/agg are similar, either AGG or BOND seems best (ief is similar return but more volatile)
tip duration is 8yr, stip is 2.6yr, shy is 1.8yr, mint is .4yr, agg is 5.3yr, bnd is 5.7yr, lqd is 8.1yr, jnk is 4.25yr, hyg is 4.14,
some bonds: http://stockcharts.com/h-perf/ui?s=AGG&compare=STIP,BOND,TIP,IEF&id=p54913239755
todo:
emerging market bonds: emb pcy emlc lemb eld vwob dsum emcb ebnd kcny chnb cemb cbon emcd emag http://etfdb.com/etfdb-category/emerging-markets-bonds/ us govt: iei govt scho vgsh tlh http://etfdb.com/etfdb-category/government-bonds/ corporate : csj vcsh ciu vcit http://etfdb.com/etfdb-category/corporate-bonds/ junk: bkln sjnk hys shyg http://etfdb.com/etfdb-category/high-yield-bonds/ inflation: tip tdtt vtip schp wip ipe stip tdtp ilb ltpz tipz (wip is international, ilb is global) http://etfdb.com/etfdb-category/inflation-protected-bonds/ international govmt: bwx igov bwz ishg aunz ald ggov http://etfdb.com/etfdb-category/international-government-bonds/ money market: mint shv bil near gsy http://etfdb.com/etfdb-category/money-market/ total bond: bnd agg bsv biv bndx bond schz gvi blv totl lag pcef http://etfdb.com/etfdb-category/total-bond-market/
---
" When could higher rates boost fund income returns enough to offset the price drop?
Now, you may ask, "How long might this take?" The illustration below (("Time to recovery" for sample intermediate-term fund"; "assumes an average interest rate of 3.0%, an even 1% increase in rates each year for the first five years, an average duration of 4.5 years and reinvestment of interest income. It shows cumulative return, not annualized return or dividend yield")) shows the hypothetical "time to recovery," also known as the breakeven point, using some basic assumptions. Utilizing the illustration below as an example, if interest rates were to rise by 1% per year, it would take approximately 3.5 years to break even, and after six years, the fund would be up about 12%. Assuming a fund with a shorter time horizon, it would take a shorter amount of time to recover the loss due to rising interest rates. The point is that although the fund experienced a loss initially due to rising interest rates, over time, the fund's return actually turned positive even though interest rates were rising during this time period.
"
http://www.bankrate.com/finance/investing/bond-investing-in-rising-rate-environment-1.aspx
---
recessions and stock markets:
http://seekingalpha.com/article/3508206-you-dont-need-a-recession-to-fall-into-a-bear-market
vs
"The big stock declines are all associated with recessions, so accurate identification is vital." -- http://seekingalpha.com/article/3506786-weighing-the-week-ahead-to-hike-or-not-to-hike
---
stock prices lead trailing EPS; also EPS estimates tend to start high and fall over time, so instead use a rolling window of forward 12 month EPS estimates; also "The Street is terrible at turning points and analysts has never correctly forecasted an economic downturn" -- http://humblestudentofthemarkets.blogspot.com/2015/09/why-you-shouldnt-freak-out-about.html
the illiquidity of hedge fund investments leads to effective smoothing of returns, which causes the usual formulae to overestimate their alpha: http://kelley.iu.edu/Finance/Symposium/files/smoothing_Rossi.pdf
---
note: a requirement of 0 probability of 100% loss would imply:
A more aggressive stance would be to assume that there is a zero percent chance of stock market value falling to some fraction of book value. Is this supported empirically?
---
https://www.bogleheads.org/forum/viewtopic.php?t=124018
---
" Harry Markowitz received the Nobel Prize in Economics in 1990 for his work on mean-variance optimisation that provided the foundations for Modern Portfolio Theory (MPT). Yet as Gerd Gigerenzer notes, when it came to investing his own money, Markowitz relied on a simple heuristic, the “1/N Rule” which simply allocates equally across all N funds under consideration. At first glance, this may seem to be an incredibly irrational strategy. Yet, there is compelling empirical evidence backing even such a simple heuristic as the 1/N Rule. Gigerenzer points to a study conducted by DeMiguel?, Garlappi and Uppal (DMU) which after comparing many asset-allocation strategies including Markowitz mean-variance optimisation concludes that “there is no single model that consistently delivers a Sharpe ratio or a CEQ return that is higher than that of the 1/ N portfolio, which also has a very low turnover.” "
---
--
http://www.macroresilience.com/2010/07/08/heuristics-and-robustness-in-asset-allocation/
---
disagrees with "Although financial conditions eased, market uncertainty is likely to remain high as investors refocus on the timing of a "first" Fed hike, China's economic slowdown, and oil price volatility. The uncertain market environment ensures that macro forces will stay top of mind for fund managers. Unfortunately, elevated macro risks mean a challenging stockpicking environment as macro forces outweigh stock fundamentals...during the last month, stock correlations skyrocketed as indiscriminate macro pressures pummeled the S&P 500 index and weighed on the stock-picking environment. [...] As correlations spiked, return dispersion -- measured as the cross-sectional standard deviation of stock returns -- fell, leaving bottom-up stock pickers with a diminished opportunity set for generating alpha."
claiming that "All other things equal, it's precisely when "macro forces outweigh stock fundamentals" that the stock-picking environment is likely to be most favorable."
" Simply put, as stock prices move in closer unison (higher correlations), the differences across individual stocks' returns narrow (lower return dispersion). That's perfectly true, and it explains why stock pickers' trailing short-term returns have become less differentiated. However, it doesn't tell us anything about stock pickers' prospective long-term returns and their ability to beat the market. "
---
" When Interest Rates Rise, Which Assets Go Up and Which Go Down? By James Debevec Jan 24, 2013 10:45 am
...this article will focus on the seven periods of rising interest rates within the 1981-2012(?) bull market.
... The big winner is oil. Oil is ranked No. 1 in both overall return and in the difference column as well. The only two assets that were up in every one of the seven time periods of rising interest rates listed above were oil and palladium. Of the four major asset classes, stocks ruled supreme over commodities, housing, and bonds. The big losers were bonds and utilities. " -- http://www.minyanville.com/business-news/markets/articles/When-Interest-Rates-Rise-Which-Assets/1/24/2013/id/47596
generally in his chart, equities, then commodities (esp. oil, then metals) (differentially) went up a lot (10% for commodities as a whole; 30% for oil; 20% for stocks); bonds and utilities went down (10% for utilities; 20% for bonds). Interesting, houses went up only slightly (2.5%), and transports and banks went down slightly (2.5%). Note that his chart is only price returns, not total returns.
however http://www.investopedia.com/articles/investing/052814/these-sectors-benefit-rising-interest-rates.asp says financials benefit from rising rates, including banks, brokers, insurers(!). Also industrials.
http://www.forbes.com/sites/trangho/2015/05/30/how-to-invest-in-the-stock-market-as-interest-rates-rise/ suggest short-term bonds
http://news.morningstar.com/articlenet/article.aspx?id=687376 mentions:
http://moneymorning.com/2013/09/17/the-best-investments-to-hold-when-interest-rates-rise/ suggests discount retailers and utilities(!) and gold
(!) means recommendations in some of these which contradict the others
"Whether rising interest rates will help or hurt U.S. stocks is a more complicated question.
All else being equal, a hike should hurt. One big reason is many investors choose whether to put money into either stocks or bonds, as bond yields pay more stocks become comparatively less attractive. But there are lots of other things to consider. For instance, stocks typically reflect investors’ attitudes about the overall health of the economy. And the if the Fed is signaling that it might raise rates, then it also thinks the economy is healthy enough to handle it. Other investors might view this as a bullish signal.
What does history say? The record is mixed. Stock researcher S&P Capital IQ recently examined 16 previous rate tightening cycles since World War II and found that the Fed’s moves led to stock market declines of 5% or more about four-fifths of the time. However, a separate study by T. Rowe Price looked at the question slightly differently: T. Rowe examined nine instances since 1954 that the Fed has raised rates following a recession. It found an average market gain of 14% a year later. In other words, it’s hard to know exactly how the market will react—except to say that it could be bumpy ride. " -- http://time.com/money/3749580/higher-rates-winners-losers/
---
look for fee-ONLY financial advisors:
" Commission-based advisors with insurance licenses sell you whatever form of annuity would have performed well over the past decade. They say they are fee-based, at least partly to sound more like fee-only financial planners. If you are confused by these distinctions, then 93% of the financial services world who can’t call themselves fee-only are doing their jobs well. You do well when you remember that fee-based is not the same as fee-only. "
---
" Imagine that Thomas and Martha Jefferson, ages 64 and 62, respectively, purchase an immediate annuity that will pay them a guaranteed 6% annual return. If they have $500,000, they would receive $30,000 every year for the rest of their lives. ... Second, the annuity does not have a 6% return, even if the Jeffersons lived forever. Buying an annuity begins with the immediate loss of 100% of your original investment ... The entire selling point of the annuity is a lower return in exchange for a guarantee. But when analyzed, the purchase price is a loss you can never recover from. We can analyze this annuity purchase like an investment and calculate an internal rate of return (IRR). For the first 15 years, the IRR is 0% because the annuity company simply hands you back your own money.
If Thomas and Martha die after 16 years, the IRR would be 0.92%. If they live to age 85, after 23 years the IRR will finally have risen to 3.47%. If they both live to be 100, the IRR would still only be 5.57%. Even if the Jeffersons lived forever, the IRR couldn’t exceed 6% because they lost their original $500,000.
Third, immediate annuities are not indexed for inflation....$5,081 in 1970 had the same buying power as $30,000 today. Imagine thinking you had your future retirement needs guaranteed in 1970 by buying an immediate annuity paying $5,081.
Annuities offer too much income to spend early in retirement only to keep that number constant and offer too little later in life. This math error is part of their mistaken appeal to the public. We would suggest that the safe spending rate for a couple with $500,000 is only 4.17% at age 62. This would limit their annual safe spending to $20,850.
But with an appropriate asset allocation and this rate of spending, the Jeffersons would have a good chance most years to enjoy an increase in their spending allowance greater than inflation as their assets appreciated. And any unused assets could be left as an inheritance for their heirs.
Finally, I’ve used the example of a 6% or $30,000 annuity, but the best quote I was given for my sample couple was $27,569. And the quote for an annuity tied to the urban consumer version of the CPI index was for $15,814.
We don’t recommend an allocation to annuities for any portion of your portfolio. We believe an age-appropriate allocation to bonds provides a similar boost to the likelihood you will have sufficient assets in retirement. We suggest allocating five to seven years of safe spending in stable investments with the remainder in appreciating assets. "
"The term COLA (Cost of Living Adjustment) is used by insurance companies to refer to one of two types of annual increases in the monthly payment
(a) A "level" percent increase. This is when the COLA percentage does not change for the duration of your contract. The most commonly selected percentage is a 3% per year adjustment, but you can select another rate of increase. - See more at: https://www.immediateannuities.com/immediate-annuities/annuities-and-cost-of-living-adjustments.html#sthash.hqB0XPNm.dpuf
... (b) A few companies also offer a true Bureau of Labor Statistics (‘BLS’) derived Consumer Price Index ('CPI') adjustment.
... An Actuary's opinion on COLAs
In general, it takes an amount of time equal to half the number of years remaining in your life expectancy, for the monthly income level of an annuity with a COLA to reach the monthly income level of the same annuity without a COLA. ... So the real question is, if adding a COLA rider makes sense to you emotionally, but it doesn't make economic sense, should you add a COLA to your annuity? Perhaps only if you are very very sure you’ll live past the life expectancy estimate an actuary calculates you’ll live. That’s because you will not break-even on the cost of the COLA rider until you at minimum reach your normal life expectancy. "
https://www.immediateannuities.com/immediate-annuities/annuities-and-cost-of-living-adjustments.html
"Based on his early research of actual stock returns and retirement scenarios over the past 75 years, Bengen found that retirees who draw down no more than 4.2 percent of their portfolio in the initial year, and adjust that amount subsequent every year for inflation, stand a great chance their money will outlive them.[6][7]"
-- https://en.wikipedia.org/wiki/William_Bengen#The_Four_Percent_Drawdown_rule
"In 2008, Nobel Laureate William Sharpe reported that the 4% Rule isn’t without flaws. If the current economic climate was considered in the equation, approximately 57% of today’s retirees would be at-risk for outliving their assets. ...
Fast forward to 2013 and this may no longer be the answer for new retirees. In two white papers by Dr. Wade Pfau “Breaking Free from the Safe Withdrawal Rate Paradigm: Extending the Efficient Frontier for Retirement Income” and “Mitigating the Four Major Risks of Sustainable Inflation-Adjusted Retirement Income” the case is made that the 4% rule may need to be adjusted for today’s interest rate environment.
Dr. Pfau plotted 1001 different financial product allocations, evaluating what the likely end value of each mix would be and the probability of the asset producing sustainable income for life. Surprisingly, the study’s findings suggested the traditional mix of stocks and bonds produced one of the poorest levels of results. The combination found to produce the best results was comprised of traditional stocks and fixed SPIAs (Single Premium Immediate Annuities ). Pfau’s second study further examined fixed income annuities, focusing particular attention to those offering fixed indexed components. This paper’s findings suggest that fixed index annuities (FIAs) produce the best outcomes in terms of ongoing income and longevity protection for current and future retirees. Pfau concludes that a portfolio utilizing the 4% rule has a high probability to fail but through changing the bond portion to a fixed index annuity and a 30-year inflation income rider of 4%, there’s a high chance of success. (See examples of fixed index annuities in the table below.) " -- https://www.immediateannuities.com/fixed-index-annuities/how-fia-guarantees-inflation-protection.html
"If there is any chance that you might purchase an annuity to supplement your retirement income, the least expensive way to "buy" that benefit is to delay your Social Security until age 70." -- http://www.retireearlyhomepage.com/bad_annuity.html
" I ended last week’s post by saying that complex annuities may actually be less valuable to investors than their more simple counterparts.
Once we finish our tour of annuity options, you’ll better understand this potentially controversial statement.
It boils down to the fact that the value of an annuity can easily get priced away: The more bells and whistles you add, the more expensive it will be – and the less value the annuity will deliver. In this situation, the price you pay to hedge your longevity risk (the risk you could outlive your assets and face financial ruin during your old age) makes it almost impossible to achieve any real benefit.
... One internet platform called incomesolutions.com allows annuity purchasers to compare annuity contracts from one provider with that of another. The site aggregates information about annuities and charges a fee for each annuity purchase for the service and the research provided. Run by Kelli Hueler, the providers on the site are vetted based on their ratings and their active participation in the institutional market.
Of course, I’m not making any recommendations for websites or companies, but some strongly rated providers of annuities include:
Mass Mutual, New York Life, Ohio National, Prudential Financial Inc (NYSE: PRU). and MetLife?, Inc (NYSE: MET).
"
---
here is a list of stocks that a seeking alpha new top-news mentioned: http://seekingalpha.com/news/2796876-stocks-set-for-sharply-higher-open
SPY, QQQ, DIA, SH, SSO, SDS, VOO, IVV, UPRO, PSQ, SPXU, TQQQ, SPXL, RSP, QID, SQQQ, QLD, DOG, DXD, RWL, UDOW, EPS, SDOW, DDM, VFINX, BXUB, QQEW, QQQE, SPLX, SFLA, BXUC, QQXT, SPUU, UDPIX, OTPIX, RYARX
---
some things this guy (dailyfx analyst) looks at: https://twitter.com/JohnKicklighter/status/647500224785608705/photo/1
S&P 500 carry trade index (DB) emerging markets (MSCI) world equities (MSCI) fed balance sheet commodity index high yield corp debt
---
---
http://www.etfscreen.com/cchart.php?wl=sc6d&ftS=no&ftL=no&vFv=0
http://etfdb.com/fixed-income-etfs/fixed-income-etf-cheat-sheet/
http://www.proshares.com/media/documents/etf_report_bold_strategic_beta_in_bond_land_05012015.pdf
---
" "When looking back through history, there is one thing we can see with absolute certainty: every investment has an ideal environment in which it flourishes. In other words, there's a season for everything. I know that there are good and bad environments for all asset classes. And I know that in one's lifetime, there will be a ruinous environment for one of those asset classes. That's been true throughout history.
"I imagine four portfolios, each with an equal amount of risk in them. That means I would not have an exposure to any particular environment.
"First, we need 30% in stocks.Then you need long-term government bonds. 15% in intermediate term (7- to 10-year Treasuries) and 40% in long-term bonds [20- to 25-year Treasuries]. Rounded out the portfolio with 7.5% in gold and 7.5% in commodities.
"You need to have a piece of that portfolio that will do well with accelerated inflation so you would want a percentage in gold and commodities. These have high volatility. Because there are environments where rapid inflation can hurt both stocks and bonds." "
---
"
12/2/14 Update: So many of you have been asking me for a list of key points from the book so here goes :)
1. Understand the power of compound interest and save/invest 10-20% of your income. 2. You can't beat the market. 3. Fees kill your returns. Look at America's Best 401(k) or Feex to see how your 401(k) fares. 4. Hire an independent fiduciary adviser. 5. Use a Roth IRA or Roth 401(k) and pay taxes now as much as possible, since they are likely to rise in the future. 6. Forget Target Date or actively managed mutual funds. Use index funds instead. 7. Know how much you need in order to retire (use the free app to find some rough numbers. Make sure to take inflation into account since the app doesn't do that) 8. Come up with a solid asset allocation: a secure bucket (bonds, CDs, cash, etc) and a growth bucket (stocks, real estate, commodities, etc). Re-balance regularly. Take the Rutgers University risk tolerance quiz to find out how much risk you can stomach. 9. It then talks about annuities and that part will confuse a lot of people in my opinion. All I'm going to say here is that although certain annuities could potentially limit your losses, they could also limit your gains. I personally wouldn't invest any of my money in most annuities.
So where do you go from here? Since so many of you have been asking for a list of recommendations, here are a few in no particular order:
1. The Intelligent Investor. This is an outstanding book but it is not for everyone. If you are new to investing or if you are not willing to spend a lot of time researching stocks, I wouldn't recommend this book. The good news is that you don't need to buy individual stocks in order to make money in the market. But if you're the type of person who has time and wants to learn how to pick individual stocks, then this is one of the top books that I would recommend. 2. Inveduco. Someone recently shared this blog with me due to their review of Tony's book. The review is much shorter than mine but it points out some of the same problems that I and others have encountered while reading it. I have read several of their posts and they are excellent, especially the latest one that talks about the problems with most financial "self-help" books. Another advantage of Inveduco is that you can email them with your personal questions about money and investing. 3. Suze Orman. I somewhat hesitate to list her as a recommended resource. A lot of her information is solid, the problem I have with her books is that they focus too much on people's emotions instead of focusing on the mechanics of investing. 4. Clark Howard. This is a great site for general personal finance information as well as how to avoid scams. 5. The Motley Fools. They are very good, although some beginners might get overwhelmed by the amount of information on their website, radio program, etc. Overall, this site offers a wealth of information. The one thing I don't like about them that they are always trying to sell you something (investment newsletters, etc). " ...
"The goal of the nonprofessional should not be to pick winners but should rather be to own a cross section of businesses that in aggregate are bound to do well. A low-cost S&P 500 index fund will achieve this goal.
" Indexing is the way to go. Invest in great American business without paying all the fees of a mutual fund manager and hang on to those companies and you will win over the long term.
"Put 10% in short-term government bonds and 90% in a very low-cost S&P 500 index fund. (I suggest Vanguard's.) I believe the trust's long-term results from this policy will be superior to those attained by most investors-whether pension funds, institutions or individuals-who employ high-fee managers."
...
"The most important thing for me from that is that defense is ten times more important than offense. The wealth you have can be so ephemeral; you have to be very focused on the downside at all times.
"When you have a good position in something, you don't need to look at it, it will take care of itself. Where you need to be focused is where you're losing money, and that's actually when people generally don't want to look: "My account's going down. I don't even want to open it." So I've created a process overtime whereby risk control is the number one single most important focus that I have, every day walking in. I want to know I'm not losing it.
" If you lose 50%, it takes 100% to get back to where you started-and that takes something you can never get back: time."
---
some popular publicly-traded brokers:
---
fxcm offers 5% interest ?!?
not sure if this is available in the US, which i think is on the 'spreads + commissions model':
"FXCM Markets Interest: FXCM may change interest rate at any time at our discretion. Interest payments are not available for accounts on spreads + commissions model."
---
"Buffett has outperformed the S&P 500 by more than a million percentage points since he took over in 1964. But he underperformed the market in a third of all years ((and 51% of days)) -- better than a coin toss but not much." - http://seekingalpha.com/article/3550296-weighing-the-week-ahead-what-is-behind-the-recent-market-volatility 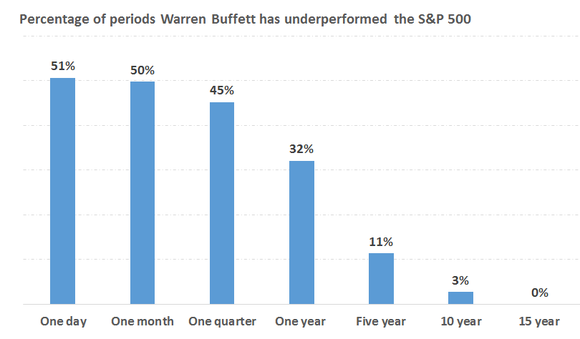
---
http://www.crestmontresearch.com/
---
http://humblestudentofthemarkets.blogspot.com/2015/11/how-patient-investor-are-you.html
" Managing career risk How many people can endure 14 years of poor performance, whether it's their own money or with client money?
We can all sit around and nod sagely that investment discipline is important, but what actually happens in the real world? Ben Carlson recently wrote about the difference between academic investment research and real world research:
When new investors are just starting out in the markets they’re often told that a paper portfolio is a good way to test out a strategy without putting real money to work. This one sounds good in theory but is fairly useless in practice.
The thing is that there are no simulations that can prepare you for the emotions you feel when investing actual money in the markets. The feelings you get from making or losing money can’t be simulated. The same is true of those who try to turn research into an investable strategy.
He highlighted a quote from an interview with Cliff Asness of AQR (emphasis added):
Well the single biggest difference between the real world and academia is — this sounds overly scientific — time dilation. I’ll explain what I mean. This is not relativistic time dilation as the only time I move at speeds near light is when there is pizza involved. But to borrow the term, your sense of time does change when you are running real money. Suppose you look at a cumulative return of a strategy with a Sharpe ration of 0.7 and see a three year period with poor performance. It does not phase you one drop. You go: “Oh, look, that happened in 1973, but it came back by 1976, and that’s what a 0.7 Sharpe ratio does.” But living through those periods takes — subjectively, and in wear and tear on your internal organs — many times the actual time it really lasts. If you have a three year period where something doesn’t work, it ages you a decade. You face an immense pressure to change your models, you have bosses and clients who lose faith, and I cannot explain the amount of discipline you need.
Managers face incredible career risk under those circumstances. Even Warren Buffett isn't perfect. CNN Money recently ran a story entitled Warren Buffett's top stocks are dogs this year, which pointed out that Berkshire top holdings (IBM, WFC, USB, GS, KO, AXP, PG, WMT) have all performed poorly this year. Now imagine that your manager is Brand X instead of a well-known name like Warren Buffett, and your Brand X manager followed a Buffet-like discipline. How much patience would you have with that manager after a bad year? "
---
" Checking In On The Robo Advisors
We all know how miserable it’s been recently for some hedge funds, now it’s time to look at some Robo Advisors. These portfolios vary depending on the needs and risk tolerance of the investor, but you can get a feel for what the returns might look like for a conservative or moderate investor. I’m using the allocation of a recent Wall Street Journal article.
Schwab Intelligent Portfolios, 30% U.S. stocks, 30% International stocks, 12% U.S. bonds, 9.49% International bonds, and 18.51% other; U.S. reit, EX-U.S. reit, IAU, 8.51% cash, this particular mix is down 5.16%.
Betterment’s mix is 33.5% U.S. Stocks, 36.4% International Stocks, 15.6% U.S. bonds, and 14.5% International bonds, this mix is down 3.66%.
Wealthfront has 41% in U.S. Stocks, 31% International stocks, 23% U.S. bonds, and 5% other (DJP), this particular mix is down 5.15% year to date. " -- http://frankzorrilla.tumblr.com/post/133300501728/checking-in-on-the-robo-advisors
---
http://seekingalpha.com/article/3689016-a-68-million-ham-sandwich
---
another argument in favor of investing in index funds (and cap-weighted ones at that):
When you invest in a cap-weighted index fund, your own portfolio is cloning the distribution of investment dollars across all the assets in the index. This means that, within that asset class, to first order, your investment doesn't alter the relative prices between these assets (it just alters the total amount of money invested in this asset pool). Why is this good? Because if you did anything else, you WOULD be altering the relative prices between these assets. Which means that you are betting that Mr. Market is wrong; you are exposed to the 'predictive driver' exposure, not just the 'investment' exposure. Betting that Mr. Market is wrong is always dangerous because Mr. Market is smarter than you.
---
"...the handful of simple financial instruction lists making the rounds among the New Year’s resolution set.
One list comes in the form of a 4-by-6 notecard that went viral in 2013, now the foundation of a book called "The Index Card: Why Personal Finance Doesn’t Have to Be Complicated." Another is the 18 steps at the back of Jonathan Clements’s "Money Guide 2016." An older but beloved (and newly updated for this column) list comes from the Dilbert cartoonist Scott Adams.
Even though their lists are fairly short, these experts agree, almost to the letter, on at least four things. You must have an emergency fund. Index funds should make up most of your investment portfolio. Buy a home, but only one that you can afford. And don’t forget life insurance, as much as you might want to. Basic term insurance is the answer for most people.
So this week, I did two things. First, I asked these writers why so many people fail to follow those four commandments, none of which are new. There must be a reason we all have to keep repeating them. Then, I asked them all to squeeze their best ideas onto an index card.
...
Why do we fail? When it comes to the lack of emergency funds, there are millions of Americans with no bank accounts at all, whether because of poor credit or poor access. Many millions more cannot afford to save anything.
As for everyone else, there are at least two big problems. The first is...shiny consumer goods...Some of the people who give in might do better with more structure...set up automatic account transfers....most money still chasing the dream of picking investments that will do better than all the others....false sense of superiority...an index fund will beat their own basket of stocks over long periods of time...All of the experts here think buying a home is a perfectly fine idea, but it has to be an affordable one. And many of us are delusional about exactly what that means....asking yourself the following question before buying: Couldn’t you just get something a little smaller? “For almost the entirety of human history, most people did not live the way that we do,” she said. “My mother grew up sharing a bedroom with her brother.”...with life insurance, where the simplest solution — term insurance — is often the best. You might pay $50 to $100 a month or so for 20 years depending on the results of a medical exam and get $500,000 or $1 million if you die (and nothing if you don’t)....
...At the end of 2014, just over $2 trillion was invested in indexed mutual funds, according to the Investment Company Institute. That amounted to about 15.6 percent of all money in American regulated funds. That’s up from just 8.9 percent of the total 10 years earlier, and it doesn’t count the $1.9 trillion at the end of 2014 that was invested in indexed exchange-traded funds, which are close cousins to mutual funds....
the index cards:
Carl Richards, New York Times contributor and author of “The One-Page Financial Plan.”: Why:
Tara Siegel Bernard, New York Times personal finance reporter:
Jane Bryant Quinn, author of “How to Make Your Money Last.”:
((i stopped writing down the rest of the cards, it was taking me too long))
---
recc. by jeff miller
---
"economist Brian Barnier, principal at ValueBridge? Advisors and founder of FedDashboard?.com. What’s more, he says previous bull runs in the market lasting several years can also be explained by single factors each time.
Barnier first compiled data on the total value of publicly-traded U.S. stocks since 1950. He then divided it by another economic factor, graphing the ratio for each one. If the chart showed horizontal lines stretching over long periods of time, that meant both the numerator (stock values) and the denominator (the other factor) were moving at the same rate. ... Scouring hundreds of different factors, Barnier ultimately whittled it down to just four factors: GDP data five years into the future, household and nonprofit liabilities, open market paper, and the Fed’s assets. At different stretches of time, just one of those was the single biggest driver of the market and was confirmed with regression analyses.
He isolated each factor in a separate chart, calling them “eras” for the stock market.
From after World War II until the mid-1970s, future GDP outlook explained 90% of the stock market’s move, according to statistical analysis by Barnier.
GDP growth lost its sway on the market in the early 1970s with the rise of credit cards and consumer debt. Household liabilities grew with plastic first, followed by home mortgages, until the real estate crash of the early 1990s. Barnier’s analysis shows debt explained 95% of the entire market’s move during this time.
The period between the mid- to late-1990s until 2000 was, of course, marked by the tech bubble. While stocks took much of the headline, that time also saw heightened activity in the commercial paper market. Startups and young companies sought cash beyond their stratospheric share values to fund their operations. Barnier’s regression analysis shows commercial paper increases could explain as much as 97% of the tech bubble.
Shortly after the tech bubble burst, a housing bubble began, once more in the form of mortgages and other debt. That drove 94% of the market’s move for the first several years of the current century.
As the financial crisis reached a fevered pitch in 2008, the Federal Reserve took to flooding the financial market with dollars by buying up bonds. Simultaneously, interest rates fell dramatically, as bond yields move in the opposite direction of bond prices. Barnier sees the Fed as responsible for over 93% of the market from the start of QE until today. During the first half of 2013, the Fed caused the entire market’s growth, he said."
---
---
" Asset class 2015 allocation Fixed income 48.6% U.S. equities 25.4% International equities 17.8% Emerging market equities 4.5% Private equity 1.3% Real estate 1.7% Cash 0.7% " -- http://www.marketwatch.com/story/feds-retirement-fund-makes-first-foray-into-real-estate-private-equity-2016-03-18
---
if it seems like you are on track to get rich in a reasonable short amount of time via capital appreciation.. then you are probably putting too much of your net worth in assets which are too volatile.
in general, if your net worth is changing appreciably in a relatively short amount of time (short enough to not be boring), then you are at least close to the limit here. This is hard to judge, however, because the nature of financial markets is to (a) have large short-term fluctuations even if average long-term movements are small, and (b) sometimes concentrate long-term moves into very short time periods within that term, rather than spreading them out evenly, and (c) rarely, have movements that are much larger than typical. So there is a fine line between taking on 'enough' volatility and 'too much' volatility though, because even eg a portfolio with 60% in the S&P 500 index, which is not crazy, will sometimes have huge increases and decreases in value in a single day (eg on 2008-10-13, the S&P 500 went up 11.58% in a single day; and this is not even counting intraday swings).
---
(i already read this, no need to reread):
http://seekingalpha.com/article/4027273-protect-portfolio-black-swans
---
---
angel investing
http://blog.rongarret.info/2017/07/things-i-wish-someone-had-told-me.html
---
---
local realestate investing
http://www.businessinsider.com/best-us-housing-markets-real-estate-investment-2017-7/#33158-palmetto-bay-florida-17 https://www.cnbc.com/2017/08/01/four-major-us-cities-ring-housing-bubble-alarm.html#ampshare=https://www.cnbc.com/2017/08/01/four-major-us-cities-ring-housing-bubble-alarm.html
---
here's that blog post about a hedge fund manager who predicted that the stock market would go up after war broke out, and whose fund-of-funds investor yelled at him, and who concludes that you shouldn't take institutional money:
http://blogs.marketwatch.com/cody/2012/06/05/painful-lessons-from-nailing-a-market-bottom/
---
sharpe ratio of owning house(s)
Housing for the long run?
| FT Alphaville |
" As you can calculate from the table above, rich-country government bonds have historically had a Sharpe ratio of about 0.2, while stocks have had a Sharpe ratio of around 0.3. A diversified portfolio of housing, by contrast, has had a Sharpe ratio greater than 0.7 since the late 1800s and greater than 0.8 since 1950! ... One possible explanation is that houses are hard to sell when you really need the money, except at a steep discount. The volume of home sales tends to collapse during recessions and rise when the economy recovers, for example, presumably because many people who might want to sell are withholding supply because they don’t like the price they think they would get. Public price indices may not fully capture this volatility in the same way that stated returns from private equity funds understate the actual riskiness of their investments. ... Housing returns are only partly determined by changes in house prices. Jorda et al created their total return index based on both capital gains and income from renting. Net rental income has historically accounted for half of the total returns from owning housing. It’s also far less volatile, dramatically boosting the Sharpe ratio compared to what you would get just by looking at changes in house prices.
Housing has beaten stocks since 1950 because rental income has been better than dividend income, not because house prices have grown more than stock prices: "
reporting on the study “The Rate of Return on Everything, 1870–2015” by Jorda, Knoll, Kuvshinov, Schularick, and Taylor
so mixed results
commercial real estate: https://am.jpmorgan.com/blobcontent/131/169/1383169203231_11_559.pdf https://www.metlife.com/assets/cao/investments/US-Core-Real-Estate-Par-Present-Future-View.pdf https://www.thestreet.com/story/13861401/2/real-estate-best-performing-asset-class-during-the-past-20-years.html
in addition, however, renting is probably economically equivalent to a house with a mortgage; so as you pay off the mortgage, you're reducing your future interest payments, which is like making an investment with a rate of return of the interest that you would have paid; this option is not available when renting, so if you moved from a rental to an owned house of the same price then eventually you'll make money in the sense of reduced monthly payments. However, if you upgrade your living standards at the same time that you buy a house, the increase in property tax and maintenance etc, compared to buying something of the same quality as your rental, may or may not cancel out this gain.
---
---
tdeck 6 hours ago [-]
http://www.kauffman.org/what-we-do/research/2012/05/we-have-met-the-enemy-and-he-is-us
Summary:
The Kauffman Foundation investment team analyzed our twenty-year history of venture investing experience in nearly 100 VC funds with some of the most notable and exclusive partnership “brands” and concluded that the Limited Partner (LP) investment model is broken ... Our research suggests that investors like us succumb time and again to narrative fallacies, a well-studied behavioral finance bias. We found in our own portfolio that:
reply
---
---
https://pensionpartners.com/put-these-charts-on-your-wall/
counterexamples to commonsense investing heuristics
---
quant strategy notes:
---
"Mozi believed that people were capable of changing their circumstances and directing their own lives. They could do this by applying their senses to observing the world, judging objects and events by their causes, their functions, and their historical bases. ("Against Fate, Part 3") This was the "three-prong method" Mozi recommended for testing the truth or falsehood of statements."
this sounds like how i think one should evaluate the big picture of business models/opportunities/strategies. Look at how the thing actually works and what makes it profitable on the micro level, look at the function that it is fulfilling for society, and look at the history of the strategy's usage/application.
---
Rebalancing when you've made money
eg when you buy a stock and it goes way up, so much so that it is now taking up too large a percentage of your net worth (this is a problem b/c of the Kelly criterion, see my discussion elsewhere). So the logical thing to do is to sell some of it, even if you feel strongly that it will go up further.
When this happens, this makes me sad, because i know that if i am right about it going up more, i will not make as much money as if i had held all of it. On the other hand, it makes me happy, because i was right and made money, and now some of that profit is 'locked in' as the trade is partially closed (eg even if the stock goes down again, at least i get to keep that bit of money). In fact, in my thinking about my assets, i consider anything in a risky asset class to be liable to disappear at any moment -- so i don't really count 'paper profits' until i sell the thing that went up. So converting paper profits to cash is a big deal for me, because now can actually count those profits as a win (of course, unless the thing went up >100%, if you are still invested at least your original amount, then you could still lose more than you made if it crashes hard enough).
Regardless of feelings, though, you have to make yourself do it because it's the rational thing to do.
---
Scott Adams [3] [4] once said that maybe you should buy stocks in companies that you hate. Interestingly, i've also heard that social ETFs that only invest in 'good' companies tend to significantly underperform indices. This suggests that you could in fact outperform a stock index by investing in an index, and then shorting the social ETFs. Why would this work?
One explanation might be cognitive dissonance. If a company seems evil but not particularly successful, you don't notice it much. But if a company seems evil and successful, that's infuriating ("they're getting away with it"). You don't want to believe that evil pays. This desire not to believe that evil wins partially masks your impression that the company is successful -- if this is happening to a lot of other investors at the same time, then the evil, successful company may be undervalued.
---
Rule of 72: arithmetic approximation to estimate the doubling time of an exponential growth process:
Doubling time = 72 / (growth rate as a percent, eg 1.06 -> 6)
Eg at 6% interest, your money takes ~72/6 = 12 years to double
---
https://github.com/zonination/investing/blob/master/README.md
---
http://www.usfinancialcapability.org/results.php?region=US
http://www.usfinancialcapability.org/downloads/tables/U.S._2015.pdf
Financial Knowledge & Decision-Making (see the PDF for the list of correct answers; i deleted that from here)
Financial Literacy
Suppose you had $100 in a savings account and the interest rate was 2% per year. After 5 years, how much do you think you would have in the account if you left the money to grow?
Imagine that the interest rate on your savings account was 1% per year and inflation was 2% per year . After 1 year, how much would you be able to buy with the money in this account?
If interest rates rise, what will typically happen to bond prices?
Suppose you owe $1,000 on a loan and the interest rate you are charged is 20% per year compounded annually. If you didn’t pay anything off, at this interest rate, how many years would it take for the amount you owe to double?
A 15-year mortgage typically requires higher monthly payments than a 30-year mortgage, but the total interest paid over the life of the loan will be less.
Buying a single company’s stock usually provides a safer return than a stock mutual fund.
Mean number of correct quiz answers 3.16 Mean number of incorrect quiz answers 1.25 Mean number of “don’t know” quiz answers 1.54
Comparison Shoppin g Compared credit cards 35% Did not compare credit cards
Making Ends Meet Difficulty covering expenses and paying bills Very difficult 11% Somewhat difficult 39% Not at all difficult 48%
Spending vs. saving Spending less than income 40% Spending about equal to income 38% Spending more than income 18% Overdraw checking account occasionally 19% Have unpaid medical bills 21%
Number of times mortgage payments have been late Once 7% More than once 9% Have taken a loan from retirement account in past year 13%
Have taken a hardship withdrawal from retirement account in past year 10%
Have experienced large unexpected drop in income in past year 22%
Planning Ahead Have emergency funds 46% Do not have emergency funds 50% Have tried to figure out retirement savings needs 39% Have not tried to figure out retirement savings needs 56% Have set aside money for children’s college education 41% Have not set aside money for children’s college education 56% Retirement Accounts Have employer-provided retirement plan (e.g., pension, 401(k)) 53% Have non-employer retirement plan (e.g., IRA, Keogh, SEP, etc.) 28% Regularly contribute to self-d irected retirement account 79% Respondents with financially dependent children Non-retired respondents Respondents with self- directed employer plan or non-employer plan Summary of Selected Findings: United States of America Respondents with checking accounts Respondents with mortgages Respondents with self- directed employer plan or non-employer plan Non-retired respondents U.S. 2015 - 1 Stocks, Bonds, and Mutual Funds Invest in stocks, bonds, mutual funds , or other securities outside of retirement account 30% Managing Financial Products Bankin g Have checking account 91% Have savings account, money market account, or CDs 75% Credit Cards Credit card behaviors in past year A lways paid credit cards in full 52% Carried over a balance and was charged interest 47% Paid the minimum payment only 32% Charged a late fee for late payment 14% Charged an over the limit fee for exceeding credit line 8% Used the cards for a cash advance 11% Other Payment Methods Use reloadable prepaid debit cards 24% Use mobile payment methods 22% Mortgages Have mortgage 57% Have home equity loan 16% Home “underwater” (negative equity) 9% Homeowners Other Debt Have student loan 26% Have auto loan 30% Non-Bank Borrowin g Non-bank borrowing methods used in past 5 years A uto title loan 10% Short term ‘payday’ loan 12% Pawn shop 16% Rent-to-own store 10% Used one or more non-bank borrowing methods in past 5 years 26%
---
a financial discipline methodology:
https://www.youneedabudget.com/
built on 4 rules:
" When you Give Every Dollar a Job, your money is dialed in. You know exactly what you can spend on eating out. On clothes. On everything. No more worrying you'll accidentally spend the money needed for next week's bills.
As you Embrace Your True Expenses, you smooth out your cash flow by breaking down larger, less-frequent expenses (holidays, birthday presents, insurance), and treating them like monthly expenses—saving for them each month. Goodbye financial roller coaster, hello financial... minivan?
Roll with the Punches when you go over budget. (It will happen and it's okay.) Spent too much on groceries this month? Just cover it with your fun money category. Covering overspending keeps you out of debt and on track.
Then the fun begins. You'll Age Your Money, working toward spending money you earned at least 30 days ago. Say goodbye to the paycheck-to-paycheck cycle, timing bills, and money stress. When a bill comes in, you’ll just pay it. If an emergency happens, you’ve got time to come up with a plan. "
---
http://notes.willcrichton.net/minimum-effort-investing/
---
https://en.wikipedia.org/wiki/Black%E2%80%93Litterman_model
---
random econ stuff: http://www.bloomberg.com/news/articles/2016-08-04/this-summer-reading-list-will-help-you-decode-fed-speak
---
according to http://people.stern.nyu.edu/adamodar/pdfiles/invphiloh/tradingcosts.pdf
spreads tend to range from 0.5% to 7%, and smaller market caps tend to have lower per-share prices (and superlinearly larger spreads as a proportion of price)
---
https://training.kalzumeus.com/newsletters/archive/investing-for-geeks?__s=esaiz3kazigwidftsigk
https://news.ycombinator.com/item?id=12515475
https://news.ycombinator.com/item?id=12515873
https://www.etf.com/docs/IfYouCan.pdf
---
old articles on volatility (VIX) ETFs (like VXX), toread:
very handy table: https://sixfigureinvesting.com/2010/12/volatility-tickers/
vqts: http://sixfigureinvesting.com/2015/07/how-does-vqts-work/
bswn, lsvx, xivh: https://sixfigureinvesting.com/2016/08/how-do-velocityshares-bswn-lsvx-xivh-work/
---
about factor ETFs (toread)
http://seekingalpha.com/article/2780275-the-best-u-s-equity-factor-etfs
---
xivh looks like an interesting way to 'short' volatility but with a max loss. otoh, lsvx looks like an interesting way to go long volatility without as much decay as usual (the trick is that you're only rewarded for long momentum-y periods of rising volatility, not short spikes)
how do bswn, lsvx compare to trsk, vqt, vxz, vspy, vixh, splv, spxh?
" Ticker 2X long % -1X short % Strategy BSWN 45% 55% Tail Risk (strong long bias) LSVX 33.33% 66.67% Long / Short (long bias) XIVH 10% 90% Hedged short volatility (strong short bias) "
TRSK: http://janus.onlineprospectus.net/janus/47103U704/index.html?where=eengine.goToDocument(%22Statutory%20Prospectus%22) .85*(SPY + VOO + IVV) + .0675*UVXY - .0825*VXX (so 85% beta + 15% vol, with the vol being 45%/55% 2x long/1x short)
SPXH: http://janus.onlineprospectus.net/janus/47103U803/index.html?where=eengine.goToDocument(%22Statutory%20Prospectus%22) .85*(SPY + VOO + IVV) + .05*UVXY - .1*VXX (so 85% beta + 15% vol, with the vol being 33%/66% 2x long/1x short)
So, the relation is that TRSK =~ .85*SPY + .15*BSWN SPXH =~ .85*SPY + .15*LSVX
" BSWN, LSVX, and XIVH and two other VelocityShares? funds (the VelocityShares? Tail Risk Hedged Large Cap ETF (TRSK) and VelocityShares? Volatility Hedged Large Cap ETF (SPXH)) do not make allocations based on signals, nor do they rely on any characteristics outside the underlying short term futures themselves. They don't shift allocations based on the term structure between short and medium-term VIX Futures, VIX term structure, VIX volatility or S&P 500 historic volatility. "
" TRSK and SPXH ETF’s offer some interesting new tradeoffs between growth and risk. Both funds use the S&P 500 index as the growth driver with 85% of the assets. The remaining 15% is invested in volatility positions "
contrast to to:
" Tickers Parameters Monitored VQT, PHDG S&P 500 volatility, VIX 5 & 20-day moving averages, Fund losses (shut down: VQTS S&P 500 volatility, VIX Futures Term Structure) XVZ VIX term structure (VIX/VXV) VIXH VIX Future absolute prices " https://sixfigureinvesting.com/2016/08/how-do-velocityshares-bswn-lsvx-xivh-work/ https://sixfigureinvesting.com/2013/07/review-trsk-spxh/
http://stockcharts.com/freecharts/perf.php?SPY,VQT,SPXH,TRSK,QAI
so far QAI looks better Sharpe-wise..
---
" The simplest case is a real estate boom. The trend that precipitates it is easy credit; the misconception is that the value of the collateral is independent of the availability of credit. As a matter of fact, the relationship is reflexive. When credit becomes cheaper and more easily available, activity picks up and real estate values rise. There are fewer defaults, credit performance improves, and lending standards are relaxed. So, at the height of the boom, the amount of credit involved is at its maximum and a reversal precipitates forced liquidation, depressing real estate values. Amazingly, the misconception continues to recur in various guises.
Other bubbles are based on different misconceptions. For instance, the international banking crisis of 1982 revolved around sovereign debt in which case no collateral was involved. The creditworthiness of the sovereign borrowers was measured by various debt ratios, such as debt to GDP or debt service to exports. These ratios were considered objective criteria, but in fact they were reflexive. When the recycling of petro-dollars in the 1970s increased the flow of credit to countries like Brazil, their debt ratios improved, which encouraged further inflows and started a bubble. In 1980, Paul Volcker raised interest rates in the USA to arrest inflation and the sovereign debt bubble burst in 1982.
Bubbles are not the only form in which reflexivity manifests itself. They are just the most dramatic and the most directly contradictory to the efficient market hypothesis, so they do deserve special attention. But reflexivity can take many other forms. In currency markets, for instance, the upside and downside are symmetrical so that there is no sign of an asymmetry between boom and bust. But there is no sign of equilibrium, either. Freely floating exchange rates tend to move in large, multi-year waves. " [5]
" The design of the common currency had many flaws. Some of them were known at the time the euro was introduced. Everybody, for example, knew that it was an incomplete currency; it had a central bank, but it did not have a common treasury. The crash of 2008, however, revealed many other deficiencies. In retrospect, the most important was that by transferring the right to print to money to an independent central bank, member countries ran the risk of default on their government bonds. In a developed country with its own currency, the risk of default is absent because it can always print money. But by ceding or transferring that right to an independent central bank, which no member state actually controls, the member states put themselves in the position of third-world countries that borrow in a foreign currency.
This fact was not recognized either by the markets or by the authorities prior to the crash of 2008, testifying to their fallibility. When the euro was introduced, the authorities actually declared government bonds to be riskless. Commercial banks were not required to set aside any capital reserves against their holdings of government bonds. The European Central Bank (ECB) accepted all government bonds on equal terms at the discount window. This set up a perverse incentive for commercial banks to buy the debt of the weaker governments in order to earn what eventually became just a few basis points, because interest rates on government bonds converged to practically zero. This convergence in interest rates caused divergences in economic performance. The weaker countries enjoyed real estate and consumption booms, while Germany, which was dealing with the burden of reunification, had to adopt fiscal austerity and structural reforms.
After the Lehman bankruptcy European finance ministers declared that no other systemically important financial institution would be allowed to fail; Chancellor Merkel then insisted that the obligation should fall on each country individually, not on the European Union or the Eurozone collectively. That was the onset of the euro crisis. It took markets more than a year to react to it. Only when Greece revealed a much larger than expected fiscal deficit did markets realize that Greece may actually default on its debt - and they raised risk premiums with a vengeance not only on Greek bonds but also on the bonds of all the heavily indebted member countries.
A Greek default would have created a worse banking crisis than the Lehman bankruptcy. The authorities put together a number of rescue packages but they always did too little too late; so conditions in Greece continued to deteriorate. This set a pattern for the other heavily indebted countries such as Spain, Italy, Portugal, and Ireland as well. While the actions of the ECB have calmed the markets, the crisis is still far from resolved. Rather than an association of equals, the Eurozone became divided into two classes: creditors and debtors. In a financial crisis, the creditors call the shots. The policies they are imposing perpetuate the division because the debtors have to pay risk premiums, not only on government bonds but also on bank credit. The additional cost of credit, which is a recurrent burden, makes it practically impossible for the heavily indebted countries to regain competitiveness.
This is not the result of an evil plot. It was caused by a lack of understanding of an extremely complicated reality. " [6]
---
Sprott Buzz Social Media Insights ETF BUZ
---
acsi 'customer satisfaction ETF' http://www.marketwatch.com/story/customers-love-these-companies-but-should-investors-love-the-satisfaction-etf-2016-11-07
---
https://blogs.cfainstitute.org/investor/2014/02/10/top-anecdotal-signs-of-a-market-bubble/
great article:
" 10 February 2014 Top Anecdotal Signs of a Market Bubble By Jason Voss, CFA Posted In: Drivers of Value, Portfolio Management
At the risk of further inflating the bubble in discussion about whether or not global equity markets are in a bubble, I think it is worth discussing the topic from a qualitative point of view. Most of the talk of bubbles is data-driven analysis focusing on things like multiples, profit margins, revenue growth, historic equity market tops, equity risk premiums, and so forth.
But having worked as a professional money manager through two market bubbles — dot-com and real estate — I can attest that qualitative signs are often more persuasive than the quantitative signs. Over the years I have identified anecdotal signs of financial excess, and I couple these signs with hard data, such as comparing current valuation levels relative to historical data, to determine if financial markets are in a bubble.
Here then, are my top anecdotal signs of a market bubble:
    Covenant creep – Here the terms for new financial securities are especially bad for buyers. In the bond market, this may mean significantly lower coupons; massively reduced call protection; no to low call premiums; an increase in the number of embedded derivatives designed to appeal to a “hot” market; and so forth. In the equity market, this can mean the issuance of shares with no to limited voting rights; a further alteration in your ability to elect board members; and so forth.
    New issue time to market massively reduced – Similar to covenant creep, above, is the reduction in the amount of time a buyer has to consider a prospective new issue, debt, or equity. At one point in the dot-com era, new billion dollar issues were being announced just shortly before the close of the financial markets and yet being priced several hours later. Clearly this is not enough time to do your proper due diligence in researching a security to fulfill your fiduciary duty.
    Stock splits actually lead to a “pop” in share price – Say you and three of your pals order a 45 centimeter pizza at a restaurant for €20. Further, you ask your waiter to please ensure that the pizza is sliced into 8 slices so each of you may have two slices of pizza. All of a sudden the waiter comes back and says, “We have a special offer on your 45 centimeter pizza: we can slice it into 16 slices, and then each of you can have four slices each. But it’s going to cost you an additional €5.” If you were a true financial pro you would likely retort, “But it’s still the same 45 centimeter piece of pizza, just sliced more.” Welcome to the world of the stock split, the most enervating of all market stupidness, in which simply slicing the same corporate pizza more ways results in a bump in stock price. If the market actually falls for this legerdemain and bumps the share price of a company up after a stock split announcement, then you are likely in a bubble.
    Art sales are front page news – Only in a bubble do the latest results of an art auction at a big house, such as Sotheby’s or Christie’s, make front page news. After all, only in a market bubble are people making such crazy money so that it becomes disposable enough to spend a fortune on a speculative asset.
    Trust us, because you’re an idiot – Market bubbles are often confusing because, on one hand, those who know their market history can see in the hard data that valuations are insane, yet on the other hand, no one seems to care. In the midst of this tug-of-war of opinion will be those who talk of your inability to recognize the unique moment of history that you are currently so privileged to experience firsthand. Or these same folks will talk of new magical paradigms that are being hatched without full acceptance by the old-timers. In other words, “trust us, because you’re an idiot” rules the day. If you feel dumb, despite your accumulated wisdom, you are likely in a bubble.
    Hubris rising – If you look at the front page of a financial industry news source and there are stories about which bespoke tailor is the most prestigious currently, or which cities are best to refuel a private plane, or why the Four Seasons in Turks and Caicos should get a new origami towel folder, you are likely in the middle of a bubble.
    Loads of new jargon – Bubbles are always accompanied by loads of new jargon usually to describe new phenomenon unique to the bubble, such as: “price-to-eyeballs,” “mortgage backed security,” or “swaption.” While you may be familiar with these terms now, there was a time when these terms led to immediate head scratching. If you find yourself with your years of financial industry experience wondering, “What is that?” then you are likely in the midst of a bubble.
    Relatives ask you crazy investment questions – When Uncle Joe asks you about whether or not swaptions are good for his retirement account, or your mom wants to know which online discount brokerage is kindest to options traders, then you are most certainly in a bubble.
    Everyone is an investment expert – This is, of course, the classic anecdotal bubble sign and is also a close corollary to your relatives asking crazy questions. It typically takes the form of your taxi driver or hairdresser offering you unsolicited investment advice. Another, more insidious form is when folks who probably don’t know about investing tell you their opinion about the current head of your nation’s central bank. Bubble? No doubt.
    Investment news leads the regular news cast – If you go to your favorite website or turn to your favorite television channel and the lead news story is consistently about new highs in financial markets, or about new companies going public then you are likely in the midst of a market bubble.
    Sales jobs are all you hear about – In the midst of the dot-com bubble many people left behind established careers to study to be stock brokers. Meanwhile, in the middle of the real estate bubble, many people also abandoned loyal companies to become realtors. If the hottest career is in selling assets, then there is a good chance that you are in a bubble.
If you liked this post, don’t forget to subscribe to the Enterprising Investor. "
---
toread
https://cs007.blog/ https://news.ycombinator.com/item?id=15786703
---
---
schwab intelligent portfolios
when you start, before you answer any questions, the portfolio is fixed income 70%, cash 30% (actually 70.6% and 29.4%).
first question is:
My goal for this account is to __
prepare for retirement: fixed income 61.5% stocks 15% cash 22.5% commodities 1% save for major upcoming expenses (education, health-bills, etc.): fixed income 70.6% cash 29.4% save for something special (vacation, new car, etc.): fixed income 61.5% stocks 15% cash 22.5% commodities 1% build a rainy day fund for emergencies: fixed income 70.6% cash 29.4% generate income for expenses: fixed income 70.6% cash 29.4% build long term wealth: fixed income 56% stocks 28% cash 15% commodities 1%
I have __ understanding of stocks, bonds and ETFs: no, some, good, extensive
When I hear "risk" related to my finances, __: I worry I could be left with nothing, I understand that it's an inherent part of the investing process, I see opportunity for great returns, I think of the thrill of investing.
Have you ever experienced a 20% or more decline in the value of your investments in one year?: yes, no
If I ever were to experience
| When you experienced a 20% or more decline in the value of my investments in one year, I would | you __: sell everything, sell some, do nothing, reallocate my investments, buy more. |
When it comes to making important financial decisions __: I try to avoid making decisions, I reluctantly make decisions, I confidently make decisions and don't look back.
however if you select 'build long term wealth' and then choose NO understanding, WORRY, NO, SELL EVERYTHING, AVOID MAKING DECISIONS, then your allocation becomes 61% stocks 23.5% fixed income 10.5% cash 5% commodities. So maybe the allocations given above after question 1 are meaningless.
So, here are the allocations for each goal for NO understanding, WORRY, NO, SELL EVERYTHING, AVOID MAKING DECISIONS (i tried time horizons of 25yr, 10yr, and 5yr, and in some, 1yr; from a little bit of testing i think those are the only relevant numbers but i didn't reconfirm that in every scenario):
prepare for retirement 11yr-60yr: 61% stocks 23.5% fixed income 10.5% cash 5% commodities prepare for retirement 6yr-10yr: 45% stocks 38.5% fixed income 12.5% cash 4% commodities prepare for retirement 2yr-5yr: 28% stocks 56% fixed income 15% cash 1% commodities prepare for retirement 1: same as 2yr-5yr save for major upcoming expenses (education, health-bills, etc.) 11yr-60yr: 54% stocks 29% fixed income 12% cash 5% commodities save for major upcoming expenses (education, health-bills, etc.) 6yr-10yr: 37% stocks 47.2% fixed income 13.8% cash 2% commodities save for major upcoming expenses (education, health-bills, etc.) 2yr-5yr: 28% stocks 56% fixed income 15% cash 1% commodities save for major upcoming expenses (education, health-bills, etc.) 1yr: 15% stocks 61.5% fixed income 22.5% cash 1% commodities save for something special (vacation, new car, etc.): same as prepare for retirement build a rainy day fund for emergencies 11yr-60yr: 45% stocks 38.5% fixed income 12.5% cash 4% commodities build a rainy day fund for emergencies 6yr-10yr: 37% stocks 47.2% fixed income 13.8% cash 2% commodities build a rainy day fund for emergencies 2yr-5yr: 15% stocks 61.5% fixed income 22.5% cash 1% commodities build a rainy day fund for emergencies 1 yr: 70.6% fixed income 29.4% cash generate income for expenses 10yr-60yr (??is this right? in the other risk profile it was 10-19 and 20-60) (time horizon is 'need income for ___ years', rather than when you start withdrawing): 28% stocks 56% fixed income 15% cash 1% commodities (same as prepare for retirement 1yr-5yr) generate income for expenses 1yr-9yr: 70.6% fixed income 29.4% cash (same as emergency fund 1yr) build long term wealth: same as 'prepare for retirement'
And here are the allocations for each goal for EXTENSIVE understanding, THRILL, YES, BUY MORE, CONFIDENTLY MAKE DECISIONS:
prepare for retirement 11yr-60yr: 77% stocks 11% fixed income 7.3% cash 4.7% commodities prepare for retirement 6yr-10yr: 54% stocks 29% fixed income 12% cash 5% commodities prepare for retirement 2yr-5yr: 45% stocks 38.5% fixed income 12.5% cash 4% commodities prepare for retirement 1yr: 37% stocks 47.2% fixed income 13.8% cash 2% commodities save for major upcoming expenses (education, health-bills, etc.) 11yr-60yr: 69% stocks 17% fixed income 8.2% cash 5.8% commodities save for major upcoming expenses (education, health-bills, etc.) 6yr-10yr: 45% stocks 38.5% fixed income 12.5% cash 4% commodities (same as prepare for retirement 2yr-5yr) save for major upcoming expenses (education, health-bills, etc.) 2yr-5yr: 37% stocks 47.2% fixed income 13.8% cash 2% commodities (same as prepare for retirement 1yr) save for major upcoming expenses (education, health-bills, etc.) 1yr: 15% stocks 61.5% fixed income 22.5% cash 1% commodities save for something special (vacation, new car, etc.): same as prepare for retirement build a rainy day fund for emergencies 11yr-60yr: 65% stocks 21.5% fixed income 8.5% cash 5% commodities build a rainy day fund for emergencies 6yr-10yr: 45% stocks 38.5% fixed income 12.5% cash 4% commodities (same as prepare for retirement 2yr-5yr) build a rainy day fund for emergencies 2yr-5yr: 15% stocks 61.5% fixed income 22.5% cash 1% commodities (same as save for major upcoming expenses 1yr) build a rainy day fund for emergencies 1yr: 70.6% fixed income 29.4% cash generate income for expenses 20yr-60yr (time horizon is 'need income for ___ years', rather than when you start withdrawing): 45% stocks 38.5% fixed income 12.5% cash 4% commodities (same as prepare for retirement 2yr-5yr) generate income for expenses 10yr-19yr: 37% stocks 47.2% fixed income 13.8% cash 2% commodities (same as prepare for retirement 1yr) generate income for expenses 1yr-9yr: 70.6% fixed income 29.4% cash (same as emergency fund 1yr) build long term wealth 11yr-60yr: 77% stocks 11% fixed income 7.3% cash 4.7% commodities (same as prepare for retirement 11yr-60yr) build long term wealth 6yr-10yr: 65% stocks 21.5% fixed income 8.5% cash 5% commodities (same as emergency fund 11yr-60yr) build long term wealth 2yr-5yr: 45% stocks 38.5% fixed income 12.5% cash 4% commodities (same as prepare for retirement 2yr-5yr) build long term wealth 1yr: same as build long term wealth 2yr-5yr
so, here are the ranges that whoever designed this thinks are not crazy:
overall: stocks: 0-77% fixed income: 11-70.6% cash: 7.3-29.4% commodities: 0-5.8% 20yr+ horizon: stocks: 28-77% fixed income: 11-56% cash: 7.3-15% commodities: 1-5.8% 1yr-5yr horizon: stocks: 0-45% fixed income: 38.5-70.6% cash: 12.5-29.4% commodities: 0-4% (note: although they differ in general, the range is the same for 1yr and for 2-5yr) low risk tolerance: stocks: 0-61% fixed income: 23.5-70.6% cash: 10.5-29.4% commodities: 0-5% high risk tolerance: stocks: 0-77% fixed income: 11-70.6% cash: 7.3-29.4% commodities: 0-5.8% prepare for retirement: stocks: 28-77% fixed income: 11-56% cash: 7.3-15% commodities: 1-5% save for major expenses: stocks: 15-69% fixed income: 17-61.5% cash: 8.2-22.5% commodities: 1-5.8% emergency fund: stocks: 0-65% fixed income: 21.5-70.6% cash: 8.5-29.4% commodities: 0-5% income: stocks: 0-45% fixed income: 38.5-70.6% cash: 12.5-29.4% commodities: 0-2% build wealth: stocks: 28-77% fixed income: 11-56% cash: 7.3-15% commodities: 1-5%
if we look at the extreme points at the edges of the overall ranges, we find:
build a rainy day fund for emergencies 1 yr, generate income for expenses 1yr-9yr: 70.6% fixed income 29.4% cash prepare for retirement 11yr-60yr (high risk tolerance), build long term wealth 11yr-60yr (high risk tolerance), save for something special (vacation, new car, etc.) 11yr-60yr (high risk tolerance): 77% stocks 11% fixed income 7.3% cash 4.7% commodities save for major upcoming expenses (education, health-bills, etc.) 11yr-60yr (high risk tolerance): 69% stocks 17% fixed income 8.2% cash 5.8% commodities
if we remove these points (meaning that we assume that the investment is not going to be converted into must-have cash soon, and that it is also not a high-risk many-decades investment) we get:
overall: stocks: 15-65% fixed income: 21.5-61.5% cash: 8.5-22.5 commodities: 1-5%
---
farmcrowdy
---
https://retirementplans.vanguard.com/VGApp/pe/pubeducation/calculators/RetirementNestEggCalc.jsf
---
https://www.financialsamurai.com/the-ideal-withdrawal-rate-for-retirement-doesnt-touch-principal/
(the upshot: plan for no more than 2% withdrawal per year in retirement)
---
---
---
Tableau Software (DATA) and Qlik Technologies (QLIK)
Hortonworks (HDP), Datawatch (DWCH), Micro Strategy (MSTR), New Relic (NEWR), PROS Holdings (PRO), Splunk (SPLK) and Teradata (TDC)